2014–2016 · Crash · Bubbles, Black Swans and Crisis Alpha
Oil implosion
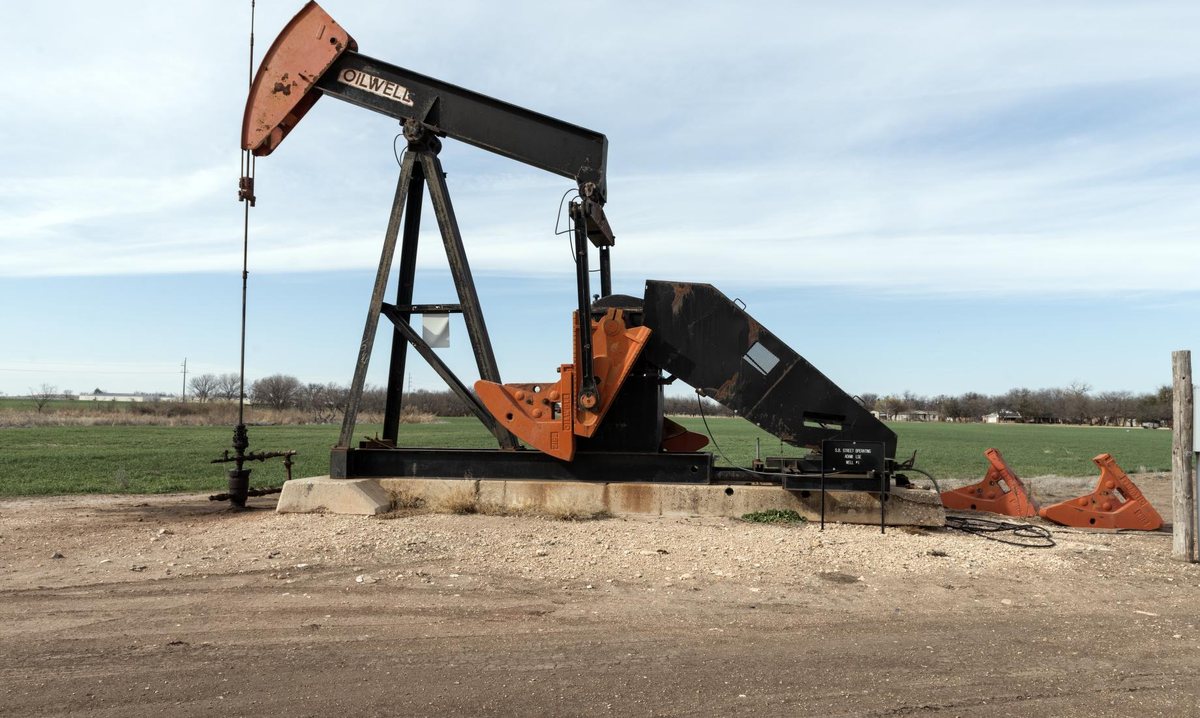
US crude oil fell from $107 to $26 a barrel in nineteen months after OPEC chose not to cut output.
- WTI high
- $107, Jun 2014
- OPEC meeting
- Nov 27, 2014
- WTI low
- $26, Feb 11, 2016
- Fall
- about 75%
What happened
By 2014 US shale drillers had come close to doubling the country's oil output in six years. Prices had held above $100 for most of three years, and few expected that to change.
Prices began to slide in the summer of 2014. On November 27 OPEC, led by Saudi Arabia, decided not to cut its own output to defend the price. Oil fell 10% the next day.
US crude kept falling through 2015 and reached $26 on February 11, 2016, down about 75% from its peak. Dozens of US oil companies went bankrupt, and oil-exporting countries such as Russia and Venezuela took the hardest blows.
For trend followers, a long fall in one of the world's largest markets was the kind of move their systems are built for.
Who lost, who won
Lost
| West Texas Intermediate crudeJun 2014 to Feb 2016 | about −75% |
Won
| Mulvaney Capital2014 | +67.4% |
| Mulvaney CapitalSeptember 2014 | +17.7% |
| Mulvaney CapitalNovember 2014 | +13.1% |
Monthly net returns from Mulvaney Capital's factsheet.
Performance figures are as published by the firms named, whose records are on file with the CFTC. Past performance is not necessarily indicative of future results. Trading University is not an agent for any firm named and makes no offer to invest.
Ideas
The record
- Books Trend Following (Michael Covel); The Invisible Hands: Top Hedge Fund Traders on Bubbles, Crashes, and Real Money (rev. ed.) (Steven Drobny)